IGNOU Data Analysis & Result Interpretation Guide – Complete Research Analysis Support
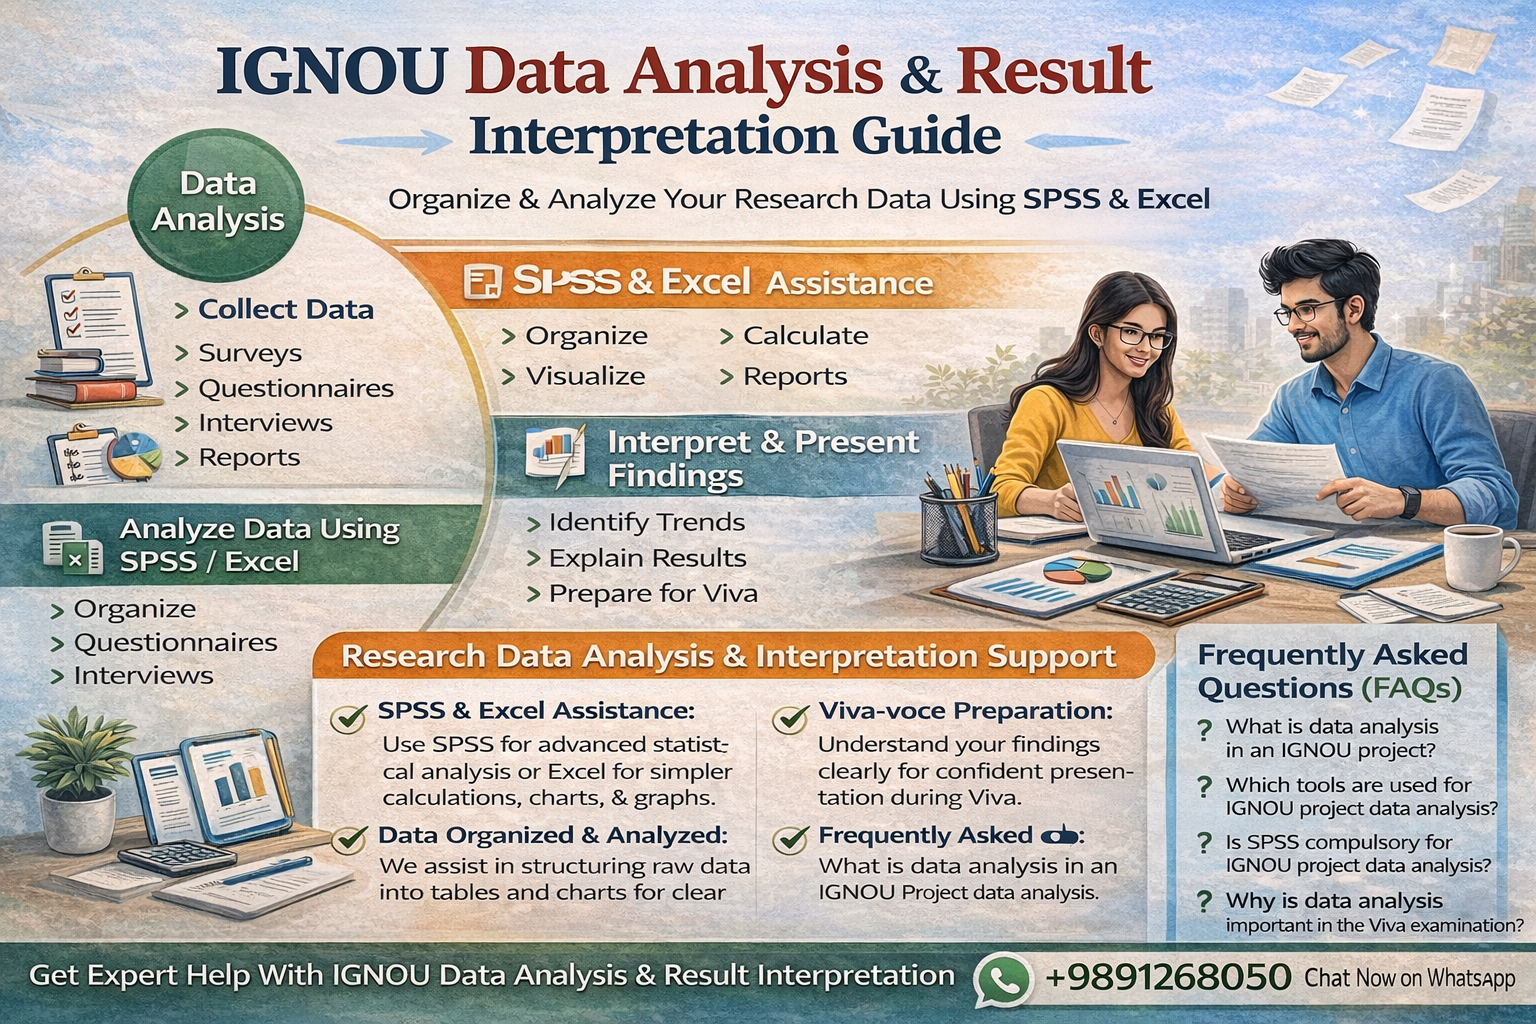
Data analysis is one of the most important stages of any academic research project. After collecting data through surveys, questionnaires, interviews, or secondary sources, the next step is to organise and interpret the information in a meaningful way. Students studying at Indira Gandhi National Open University often collect useful data for their projects but feel uncertain about how to analyse it properly or present the results in a structured academic format.
Proper data analysis and result interpretation help transform raw data into useful insights that answer the research objectives of the study. When data is organised and analysed correctly, it becomes easier for evaluators to understand the research findings and the conclusions drawn from the study.
What Is Data Analysis in an IGNOU Project? Complete Explanation
Data analysis refers to the process of examining, organising, and interpreting collected data to identify patterns, relationships, or trends. In research projects, this stage helps explain how the collected information supports the objectives of the study.
In most IGNOU projects, students collect data using:
• Questionnaires
• Surveys
• Interviews
• Observation methods
• Secondary sources such as reports or published research
Once the data is collected, it must be analysed using tables, graphs, charts, or statistical methods so that the findings can be clearly presented in the project report.
IGNOU Data Analysis Methods Used in Project Reports
Different research studies require different analysis methods depending on the nature of the research and type of data collected.
Common methods used in IGNOU project reports include:
Descriptive Data Analysis
This method summarises the collected data using basic statistical measures such as:
• Percentage analysis
• Mean or average values
• Frequency distribution
• Charts and graphs
Descriptive analysis helps present data in a clear and simple format.
Comparative Data Analysis
Comparative analysis is used when the research compares two or more variables. This method helps identify differences or relationships between data sets.
For example:
• Comparing customer satisfaction levels
• Analysing employee performance trends
• Evaluating consumer preferences
Statistical Data Analysis Using SPSS
In some projects, students use statistical software such as SPSS to perform more advanced data analysis. SPSS helps calculate correlations, regression analysis, and other statistical techniques that improve the reliability of research findings.
Using Excel for IGNOU Project Data Analysis
Microsoft Excel is one of the most commonly used tools for project data analysis because it allows students to organise large amounts of data easily.
Excel helps in:
• Creating data tables
• Generating charts and graphs
• Calculating percentages and averages
• Performing simple statistical calculations
When used correctly, Excel can present research findings in a clear visual format.
How to Write Result Interpretation in an IGNOU Project
After analysing the data, the next step is result interpretation. This section explains what the analysed data actually means and how it relates to the research objectives.
Result interpretation should:
• Explain the meaning of the analysed data
• Highlight important trends or patterns
• Connect findings with research objectives
• Present conclusions based on the data
Interpretation should be written in clear academic language so that readers can easily understand the findings.
Common Problems Students Face in Data Analysis
Many students face challenges while analysing their project data, such as:
• Difficulty organising collected data
• Confusion about which statistical method to use
• Lack of experience with tools like SPSS or Excel
• Difficulty interpreting results clearly
• Presenting data in an unstructured format
These issues often make the research findings difficult to understand.
How Structured Data Analysis Support Helps Students
Professional data analysis support helps students organise and interpret their research data in a clear and systematic way.
This support typically includes:
• Organising raw data into structured tables
• Performing analysis using Excel or SPSS
• Presenting results with charts and graphs
• Writing clear result interpretation
• Connecting analysis with research objectives
The goal is to ensure that the data analysis section of the project report is clear, professional, and academically sound.
How Data Analysis Helps in IGNOU Viva Preparation
A well-prepared data analysis section helps students confidently answer questions during the viva-voce examination. Examiners often ask about:
• How the data was collected
• Which analysis method was used
• What conclusions were derived from the findings
When students understand their own data analysis clearly, it becomes easier to explain the research results during the viva.
Frequently Asked Questions (FAQs) – IGNOU Data Analysis
1. What is data analysis in an IGNOU project?
Data analysis is the process of organising and examining collected research data to identify patterns, trends, and findings that support the research objectives.
2. Which tools are used for IGNOU project data analysis?
Students commonly use Microsoft Excel and SPSS for analysing project data and presenting results through tables, charts, and statistical calculations.
3. Is SPSS compulsory for IGNOU project data analysis?
No, SPSS is not compulsory. Many projects can be analysed using Excel or basic statistical methods depending on the research design.
4. What is result interpretation in a project report?
Result interpretation explains the meaning of analysed data and connects the findings with the research objectives and conclusions of the study.
5. Why is data analysis important for IGNOU viva?
During the viva examination, students are often asked questions about their data collection methods, analysis process, and research findings. Proper data analysis helps students explain their research confidently.